
ESP32 Temperature & Humidity Sensor Monitoring Using Grafana
The ESP32 is a powerful microcontroller with built-in Wi-Fi, making it an excellent choice for IoT projects. In this guide, we will walk you through how to collect temperature data from a BME280 sensor, send it to the cloud using Harbor Scale, and visualize it using a Grafana dashboard.
Imagine having real-time insights into temperature changes, accessible from anywhere in the world. With an ESP32 and a BME280 sensor, you can build a smart, cloud-connected monitoring system that logs environmental data and visualizes it dynamically.
In this project, you'll configure an ESP32 to read temperature data from a BME280 sensor and transmit it to Harbor Scale, a powerful IoT data platform. From there, the data is stored, processed, and displayed on a Grafana dashboard, giving you a live view of temperature trends. Whether you're tracking climate conditions, monitoring sensitive equipment, or just experimenting with IoT, this setup provides a scalable foundation for automation, alerts, and advanced analytics.
By the end of this guide, you'll have a fully functional system that not only logs temperature readings but also lays the groundwork for expanding your IoT network with more sensors, automated triggers, and cloud-based intelligence. Let's dive in!
Hardware Requirements
- ESP32 development board (NodeMCU ESP32, WROOM, etc.) - AliExpress Price 3.82USD | Amazon US Price 9.90USD
- BME280 temperature, humidity, and pressure sensor module - AliExpress Price: 4.20USD | Amazon US Price 8.99USD
- Jumper wires - AliExpress Price: 0.42USD | Amazon US Price 5.49USD
- Micro USB Power & Data - AliExpress Price: 3.00USD | Amazon US Price ~5.00USD
- Optional: 3.3V power supply for standalone deployment
Software Requirements
- Arduino IDE (1.8.13 or newer) or PlatformIO
- Required libraries:
- Adafruit BME280 Library
- Adafruit Unified Sensor
- WiFi Library (built into ESP32 core)
- HTTPClient Library (built into ESP32 core)
- Harbor Scale account (free tier available)
Step 1: Setting Up Your Development Environment
Installing ESP32 Board Support
- Open Arduino IDE
- Go to File > Preferences
- Add the following URL to the "Additional Boards Manager URLs"
https://raw.githubusercontent.com/espressif/arduino-esp32/gh-pages/package_esp32_index.json - Go to Tools > Board > Boards Manager
- Search for "ESP32" and install the ESP32 by Espressif Systems
Installing Required Libraries
- Go to Sketch > Include Library > Manage Libraries
- Search for and install:
- Adafruit BME280 Library
- Adafruit Unified Sensor
Step 2: Wiring the BME280 Sensor to ESP32
The BME280 uses the I2C communication protocol, which requires just four connections:
| BME280 Pin | ESP32 Pin | Function |
|---|---|---|
| VCC | 3.3V | Power |
| GND | GND | Ground |
| SDA | GPIO 21 | Data |
| SCL | GPIO 22 | Clock |
Step 3: Setting Up Harbor Scale
Harbor Scale provides a straightforward platform for collecting, storing, and visualizing IoT sensor data. Follow these steps to set up your account:
- Create an Account:
- Visit Harbor Scale and sign up for a new account.
- Create a New Harbor:
- From your dashboard, click Create New Harbor
- Name it something descriptive like "ESP32_Environmental_Monitor"
- Select the harbor type as General and Specification Free
- Generate an API Key:
- Navigate to "View Details" for your created harbor
- Click "View API Key"
- Copy and save your API Key securely - you'll need it for your ESP32 code
- Note your Harbor ID from the API Endpoint
Step 4: Uploading and Testing the Code
#include <Wire.h>
#include <Adafruit_Sensor.h>
#include <Adafruit_BME280.h>
#include <WiFi.h>
#include "HarborClient.h"
#include <time.h>

// WiFi credentials
const char* ssid = "WIFI_NAME";
const char* password = "WIFI_PASSWORD";

// Harbor Scale API info
const char* harborEndpoint = "API_ENDPOINT";
const char* harborApiKey   = "API_KEY";
const char* shipId         = "Living Room";

HarborClient harbor(harborEndpoint, harborApiKey);

// BME280 setup
Adafruit_BME280 bme;
#define SEALEVELPRESSURE_HPA (1013.25)

// Offsets
const float TEMP_OFFSET = 0.0;     // e.g., -3.0
const float HUMIDITY_OFFSET = 0.0; // e.g., +7.2
const float PRESSURE_OFFSET = 0.0; // hPa, e.g., -2.5
const float ALTITUDE_OFFSET = 0.0; // meters, e.g., +5.0

// LED (GPIO2) off
const int ledPin = 2;

// NTP setup
const char* ntpServer = "pool.ntp.org";
const long gmtOffset_sec = 0;
const int daylightOffset_sec = 0;

// Sleep timing
const uint64_t uS_TO_S_FACTOR = 1000000ULL;
const int SLEEP_INTERVAL_SEC = 5 * 60; // 5 minutes

// Get current UTC time as ISO8601
String getISOTime() {
  time_t now = time(NULL);
  struct tm timeinfo;
  gmtime_r(&now, &timeinfo);

  char buf[30];
  strftime(buf, sizeof(buf), "%Y-%m-%dT%H:%M:%SZ", &timeinfo);
  return String(buf);
}

// Connect WiFi with minimal retries
bool connectWiFi() {
  WiFi.begin(ssid, password);
  int retries = 0;
  while (WiFi.status() != WL_CONNECTED && retries < 15) {
    delay(200);
    retries++;
  }
  return WiFi.status() == WL_CONNECTED;
}

void setup() {
  // Reduce CPU frequency to save power during wake
  setCpuFrequencyMhz(80);

  // Disable user LED
  pinMode(ledPin, OUTPUT);
  digitalWrite(ledPin, LOW);

  // Minimal serial
  Serial.begin(115200);
  delay(100);

  // Init BME280 in forced mode
  if (!bme.begin(0x76)) {
    esp_deep_sleep(SLEEP_INTERVAL_SEC * uS_TO_S_FACTOR); // try again later
  }
  bme.setSampling(Adafruit_BME280::MODE_FORCED);

  // Connect Wi-Fi
  if (!connectWiFi()) {
    esp_deep_sleep(SLEEP_INTERVAL_SEC * uS_TO_S_FACTOR);
  }

  // Sync time
  configTime(gmtOffset_sec, daylightOffset_sec, ntpServer);
  struct tm timeinfo;
  if (!getLocalTime(&timeinfo)) {
    WiFi.disconnect(true);
    WiFi.mode(WIFI_OFF);
    esp_deep_sleep(SLEEP_INTERVAL_SEC * uS_TO_S_FACTOR);
  }

  // Read sensors (forced mode → sleeps after reading)
  bme.takeForcedMeasurement();
  float temperature = bme.readTemperature() + TEMP_OFFSET;
  float humidity    = bme.readHumidity() + HUMIDITY_OFFSET;
  float pressure    = (bme.readPressure() / 100.0F) + PRESSURE_OFFSET;
  float altitude    = bme.readAltitude(SEALEVELPRESSURE_HPA) + ALTITUDE_OFFSET;

  String isoTime = getISOTime();

  // Prepare batch
  GeneralReading readings[4];
  readings[0] = {shipId, "Temperature", temperature, isoTime};
  readings[1] = {shipId, "Humidity", humidity, isoTime};
  readings[2] = {shipId, "Pressure", pressure, isoTime};
  readings[3] = {shipId, "Altitude", altitude, isoTime};

  // Send batch
  harbor.sendBatch(readings, 4);

  // Disconnect Wi-Fi before sleep
  WiFi.disconnect(true);
  WiFi.mode(WIFI_OFF);

  // Deep sleep for 5 minutes
  esp_sleep_enable_timer_wakeup(SLEEP_INTERVAL_SEC * uS_TO_S_FACTOR);
  esp_deep_sleep_start();
}

void loop() {
  // never used, everything runs in setup + deep sleep
}- Select the Correct Board:
- Go to Tools > Board and select your ESP32 board model
- Select the correct COM port under Tools > Port
- Configure the Code:
- Replace the WiFi SSID and password with your network credentials
- Update the Harbor Scale API URL and API key with your account details
- Adjust the sensor reading interval if needed (default is 60 seconds)
- Upload the Code:
- Click the Upload button (→) in Arduino IDE
- Wait for the compilation and upload to complete
- Verify Operation:
- Open the Serial Monitor (Tools > Serial Monitor) set to 115200 baud
- Check for successful WiFi connection and sensor initialization
- Confirm data is being sent to Harbor Scale
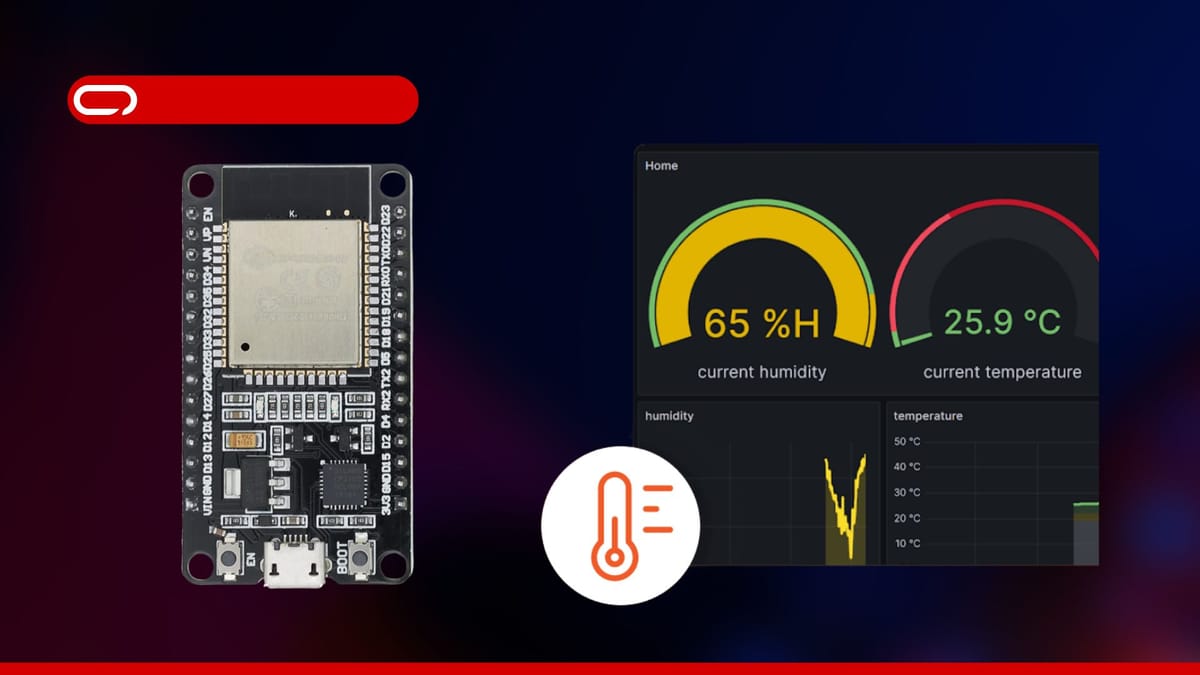
Step 5: Visualizing Data with Harbor Scale
Once your ESP32 begins transmitting data, you can create powerful visualizations in Harbor Scale through its integrated Grafana dashboards:
- Access Grafana Credentials:
- Go back to the Harbor Details page
- Copy the Grafana Password shown on this page
- Click on the Grafana Endpoint link provided
- Login to Grafana:
- Use your Grafana Username (this will be the same as your Harbor Scale email)
- Enter the Grafana Password you copied earlier
- Navigate to Dashboards:
- In the left sidebar, click on Dashboards
- Select the Comprehensive Telemetry Dashboard (this is the demo dashboard provided by Harbor Scale)
- Configure Your Dashboard View:
- Choose your data source (which will be your harbor)
- Use the filters to view data based on
ship_idandcargo_id - Select appropriate time ranges to view your sensor history
Conclusion
Your ESP32 is now up and running with the BME280 sensor, streaming live temperature data to Harbor Scale. With this setup, you can keep an eye on environmental changes in real time. Want to take it further? Try adding more sensors, setting up alerts for temperature spikes, or even building a full monitoring system. The possibilities are endless.

Comments ()