Meshtastic Coverage Simulation Official App
Learn how to optimize LoRa communication with step-by-step tutorials. Explore antenna placement, terrain effects, and power settings to improve mesh network performance. Discover tools, tips, and expert insights for accurate simulations.
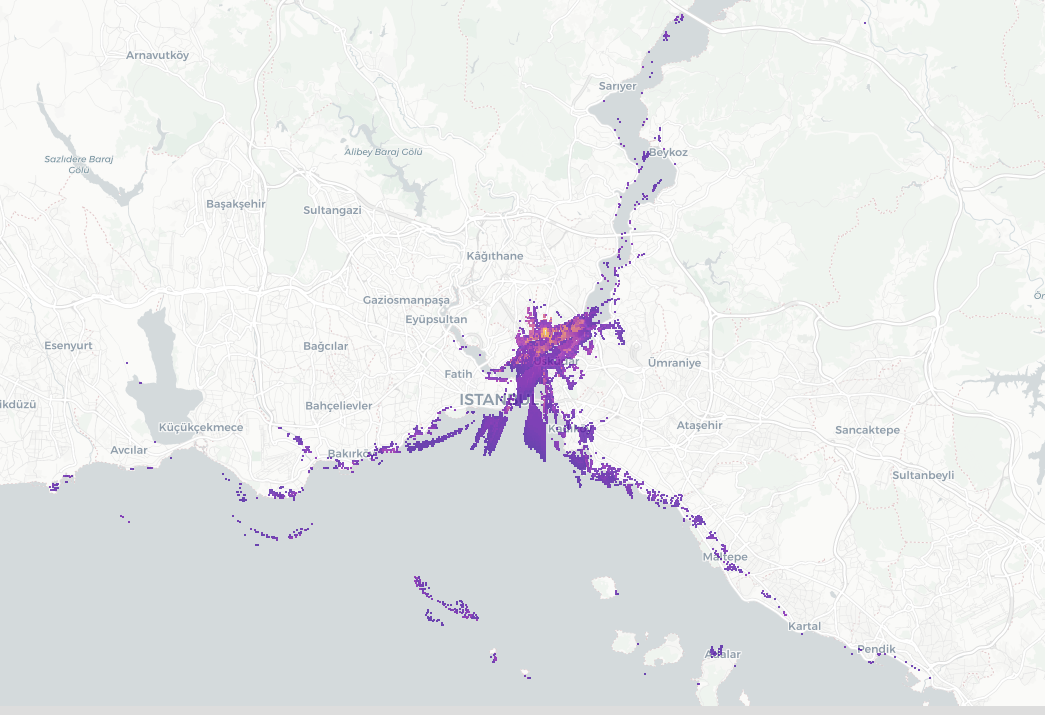
If you're diving into the world of Meshtastic and LoRa nodes, understanding your coverage area is key to maximizing communication efficiency. Knowing where your signal strength peaks and where it weakens can make all the difference, especially when working with mesh networks. In this guide, we'll walk through the process of creating accurate coverage simulations for your Meshtastic devices, ensuring you get the most out of your setup.
When it comes to LoRa communication, coverage simulations play a pivotal role in understanding how far your devices can reliably communicate. These simulations are based on various factors, including terrain, antenna specifications, and power settings. A good coverage map doesn't just show you where your signal will reach—it helps you understand where you can place your nodes for optimal performance, ensuring robust communication in your network.
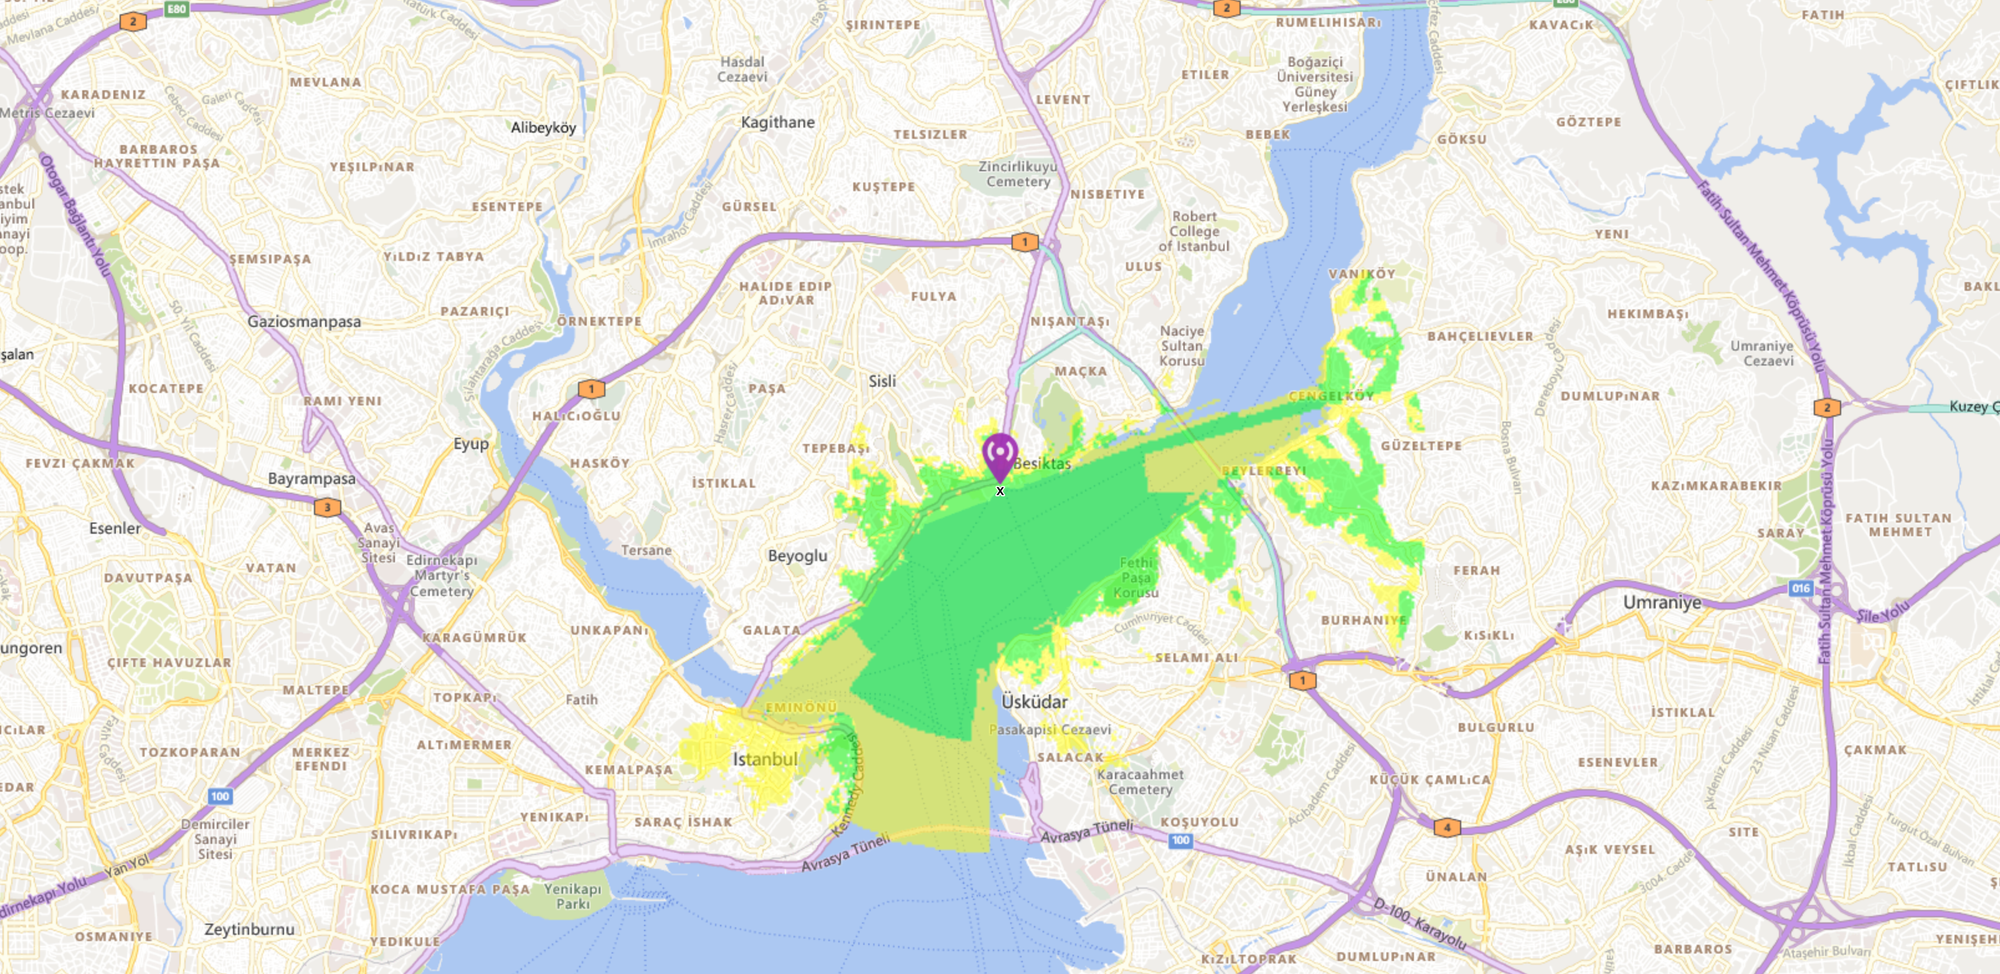
Getting Started with Meshtastic Coverage Mapping
Before diving into coverage simulations, it’s essential to understand the key factors that will influence the performance of your Meshtastic network. These elements directly impact the accuracy of your coverage maps and the efficiency of your deployment:
1. Antenna Height & Gain
The height and gain of your antenna play a crucial role in determining signal reach:
- Antenna Height: Placing your antenna higher typically improves coverage, especially in areas with hills, trees, or other obstacles. For example, mounting the antenna on a pole or rooftop can minimize interference from terrain.
- Antenna Gain: Measured in decibels (dB), gain represents how effectively the antenna focuses energy. Higher gain antennas can transmit signals farther.
2. Terrain Data
Radio waves interact with the environment, making terrain a critical factor in simulation accuracy:
- Elevation Variations: Hills, valleys, and buildings can obstruct signals or create areas with weaker coverage. Inputting detailed terrain data into your simulation tool ensures accurate predictions.
- Clutter: Clutter refers to vegetation, buildings, or other obstacles near the ground. Even a few meters of vegetation can attenuate signals, especially at lower antenna heights.
3. Node Power
The transmission power of your Meshtastic device directly impacts how far it can communicate:
- Higher Power: Increases signal strength and range but may consume more battery or exceed regulatory limits for specific frequencies.
- Optimized Power: Balancing power settings to avoid unnecessary interference with other devices or networks is crucial. For example, 0.1 W (100 mW) is a common setting that complies with most regional regulations for LoRa devices.
Step-by-Step Guide for Meshtastic Coverage Simulation
For users who may have different settings or wish to experiment with advanced options, this step-by-step guide is designed to be flexible while covering your specific requirements.
1. Configure the Site / Transmitter Parameters
This is the starting point for your coverage simulation:
- Site Name: Assign a meaningful name (e.g., "Home Base") for easy identification.
- Coordinates: Input the precise latitude and longitude of your transmitter site. You can use tools like Google Maps to obtain these values.
- Transmitter Power: Enter the device's output power in watts (e.g., 0.1 W or 100 mW).
- Frequency: Specify the operational frequency, (e.g., 433 MHz, 905 - 915 MHz or 868 MHz). Ensure compliance with local regulations.
- Antenna Height and Gain: Provide the height of the antenna (e.g., 2 m AGL) and its gain (e.g., 2 dB). These settings influence the coverage area and propagation over obstacles.
2. Define the Receiver Parameters
The receiver settings determine how well your nodes can pick up signals:
- Sensitivity: Set to the minimum signal strength the receiver can reliably detect (e.g., -130 dBm for typical LoRa devices).
- Antenna Height and Gain: Configure the receiving antenna's height (e.g., 1 m AGL) and gain (e.g., 2 dB).
- Cable Loss: Input the expected signal loss caused by the cable (e.g., 2 dB). Use high-quality / shorter cables to minimize this value. For more information read this article.
3. Adjust Environmental Settings
Realistic simulations require accurate environmental details:
- Radio Climate: Select a climate type that matches your region (e.g., Continental Temperate for most mid-latitude areas).
- Polarization: Use Vertical polarization, the standard for most LoRa devices.
- Clutter Height: Specify the average height of obstacles, such as grass (e.g., 1 m). For urban areas, adjust this to match building heights.
- Ground Properties: Use typical values for dielectric constant (e.g., 15 V/m) and conductivity (e.g., 0.005 S/m for dry soil).
4. Configure Simulation Options
Tailor the simulation to your specific use case:
- Situation Fraction: Set to 95% to simulate typical propagation scenarios.
- Time Fraction: Also set to 95% to model conditions present most of the time.
- Maximum Range: Define the maximum distance to simulate (e.g., 30 km). Adjust this value based on your deployment goals.
5. Visualize the Coverage Map
Customize the display for clearer insights:
- Signal Strength Range: Define the color scale for signal strength (e.g., -130 dBm to -80 dBm).
- Color Scale: Select an easy-to-interpret palette, like Plasma.
- Transparency: Set to 50% for better integration with map overlays.
6. Save and Apply Your Coverage Map
Once all the numbers are set, click on Run Simulations, and after a short while, you will see a new site added to the list below the button and the map updating. The strength of the signal depends on the Color Scale you chose so keep that in mind. Please note that simulations are saved only for the current session, so refreshing the browser will result in the loss of all simulations. Once you're happy with the simulation, use the Download button on the left to take a screenshot of the map. Ensure the map is displayed exactly as you want before saving it. Additionally, you can customize the map view using the Layer Settings to switch between options such as OSM (OpenStreetMap), Carto Light, Satellite, and more.
Real-World Validation: Testing Your Setup
While simulations are a great way to visualize coverage, real-world tests are essential to ensure your network performs as expected. Terrain, weather, and unexpected obstacles can alter the predicted coverage, so it's always a good idea to perform some local tests after setting up your nodes.
Conclusion
Coverage simulations are a powerful way to optimize your Meshtastic network, whether you're setting up a local mesh or planning a large-scale deployment. These tools let you see how your devices interact with their environment, factoring in critical elements like antenna gain, terrain, and obstacles to ensure reliable communication. The official Meshtastic mapping tool is a great step forward—modern, user-friendly, and an excellent starting point, though it can be a bit buggy and less precise in some cases. After testing, we found that an older, less visually appealing tool was actually more accurate, though it’s far more complex to configure and use. If you're ready to dive into a more detailed setup, we’ve written a guide to help you get started: How to Do Coverage Mapping for Meshtastic.


