How to Set Up Linux Server Monitoring with Grafana Under 5 Minutes
Harbor Scale Linux Monitoring Agent dramatically simplifies server monitoring. With a quick installation process, over 24 metrics available out-of-the-box, and seamless Grafana integration, it provides comprehensive visibility with minimal setup effort.
If there's one thing learned from years of managing Linux systems, it's that you can't fix what you can't see. That's why Harbor Scale Linux Monitoring Agent is so impressive - a tool that dramatically simplifies keeping tabs on Linux servers.
The Monitoring Problem
Let's be honest - setting up proper monitoring for Linux systems has traditionally been a pain. Administrators are either stuck cobbling together multiple tools or investing significant time configuring complex monitoring stacks. And when something inevitably breaks at 2 AM, they're left sifting through scattered logs and metrics.
That's why Harbor Scale stands out. It offers a refreshingly straightforward approach to Linux monitoring with direct Grafana integration.
What Makes Harbor Scale Different?
After testing numerous monitoring solutions over the years, Harbor Scale stands out for several reasons:
- Simplicity: The installation process takes literally minutes - no complex configurations or dependencies to manage.
- Comprehensive metrics: It collects over 24 different system metrics out of the box, from the basics (CPU, memory, disk) to more advanced metrics.
- Customization: Users can select exactly which metrics they care about and adjust sampling rates (from 1 second to 5 minutes) to match their monitoring needs.
- Grafana integration: The direct connection to Grafana means beautiful dashboards are available immediately.
Getting Started: A Quick Walkthrough
Here's how to set up Harbor Scale on Linux servers:
Step 1: Create a Harbor Scale Account
First, sign up at Harbor Scale and create what they call a "Harbor" (essentially a data collection point). The free tier works well for testing or small setups.
After creating a harbor, note down the important credentials:
- API Batch Endpoint
- API Key
- Grafana access details
The free tier supports up to 10 metrics per second.
Step 2: Install the Agent
Installation couldn't be simpler. Run these commands:
- Download the installation script:
curl -sSL -o install-monitoring.sh https://raw.githubusercontent.com/TelemetryHarbor/harbor-linux-monitor/refs/heads/main/install.sh
- Make it executable:
chmod +x install-monitoring.sh
- Run the installation script with root privileges:
sudo ./install-monitoring.sh
The interactive installer prompts for API details and guides through selecting which metrics to monitor and how frequently to sample them.
Step 3: Watch the Magic Happen
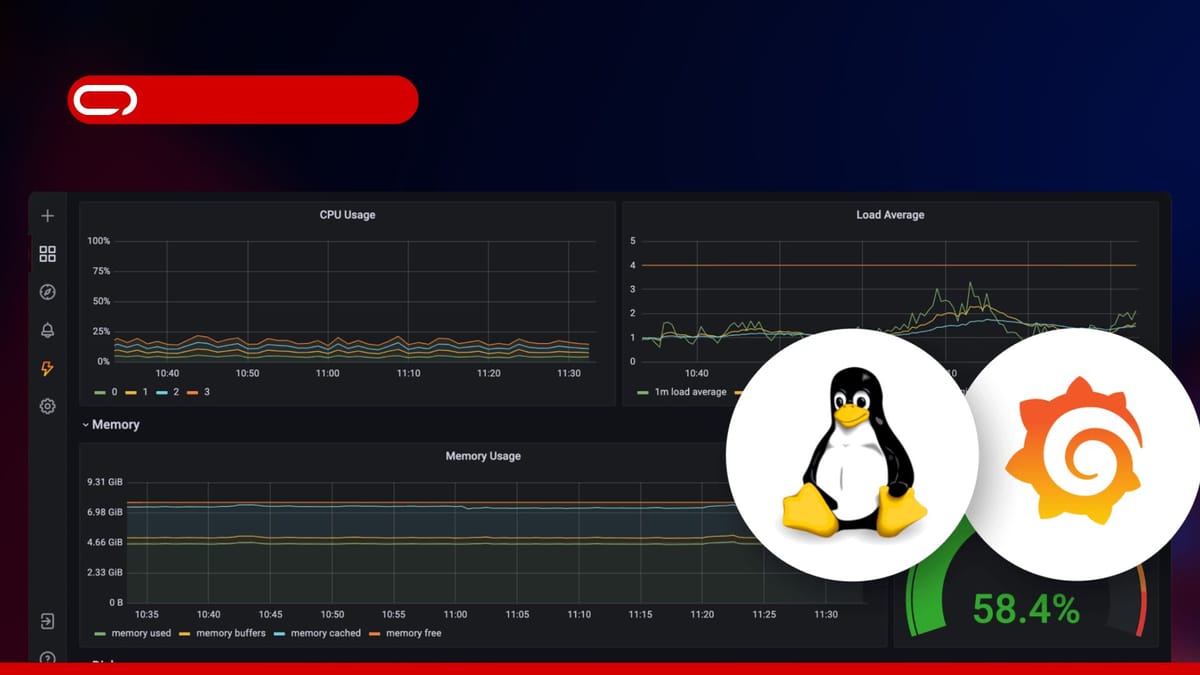
After installation, the service starts automatically with systemd integration. Within minutes, metrics begin appearing in Grafana through the Harbor Scale platform.
The Metrics That Matter
What's most impressive is the range of metrics available. Harbor Scale collects:
- CPU stats: Overall usage, per-core metrics, context switches
- Memory: Usage percentages and detailed stats
- Disk: Usage across partitions, I/O operations
- Network: Traffic rates, errors, active connections
- System: Load averages, processes (including zombies), open files
- Hardware: Temperature readings, battery stats (for laptops/devices)
Users can choose to monitor all of these or just select the ones relevant to their setup. For more information about available metrics and integration options, visit the official integration documentation.
Managing the Service
Once installed, the agent runs as a systemd service named harbor-monitor. It can be managed with standard commands:
Check service status:
systemctl status harbor-monitor
View logs:
journalctl -u harbor-monitor -f
Stop the service:
systemctl stop harbor-monitor
Start the service:
systemctl start harbor-monitor
Disable automatic startup:
systemctl disable harbor-monitor
Enable automatic startup:
systemctl enable harbor-monitor
The standard Linux service approach is particularly convenient - no proprietary management tools or unusual configurations to learn.
What Could Be Improved
While Harbor Scale is impressive overall, there are a few areas where it could improve:
- More pre-built dashboard templates would be nice
- The ability to create custom metrics would be valuable
- An easier way to select metrics
- More detailed metrics, for example RAM usage that shows which processes are consuming memory rather than just overall usage
Conclusion
Harbor Scale Linux Monitoring Agent has genuinely simplified Linux system monitoring. With minimal setup effort, administrators can gain comprehensive visibility into all servers through beautiful Grafana dashboards.
For anyone looking for an efficient way to monitor Linux infrastructure without the typical headaches, Harbor Scale is worth trying. The setup takes minutes, and the insights gained are invaluable.