How to Visualize Meshtastic Telemetry on Grafana
Integrate Meshtastic with Grafana for real-time monitoring and customizable dashboards. Visualize device data, including location, and interact with your data using Harbor AI. Effortlessly manage and analyze your telemetry with Harbor Scale
Transform your Meshtastic network into professional real-time dashboards in under 5 minutes
Meshtastic devices are incredibly powerful for creating long-range, off-grid mesh networks. But what if you want to see your network's health, battery levels, signal strength, and environmental data in beautiful, professional dashboards? That's where Harbor Scale and Grafana come in.
In this guide, I'll show you how to push telemetry data from your Meshtastic nodes to Harbor Scale and visualize everything in Grafana. The best part? Harbor Scale has completely revamped their onboarding, making it ridiculously simple to get started.
What is Meshtastic?
If you're new to Meshtastic, it's an open-source mesh networking platform that enables decentralized, long-range communication using affordable LoRa radio hardware. Check out our complete getting started guide to learn more about building your own mesh network.
Why Visualize Meshtastic Data on Grafana?
Centralized Data Collection
Harbor Scale centralizes all your Meshtastic telemetry data in one place, making it easy to manage and analyze - especially when dealing with large deployments or multiple networks.
Real-Time Insights
Grafana provides real-time dashboards that let you monitor device health, battery levels, signal strength (SNR/RSSI), environmental sensors, and network performance at a glance.
Professional Dashboards
Create customized, beautiful dashboards to visualize your telemetry data. Track individual node metrics, analyze trends over time, create heatmaps, and visualize GPS location data on interactive maps.
No Self-Hosting Required
Unlike traditional Grafana setups that require you to run your own server, Harbor Scale provides managed Grafana instances. Just sign up, connect, and start visualizing.
Harbor AI Integration
Query your data using natural language. Ask questions like "What was the average battery level of my nodes last week?" and get instant answers without building complex dashboards.
Getting Started with Harbor Scale
Harbor Scale has completely revamped their onboarding experience. What used to take multiple configuration steps now takes just 3 simple commands. Let's walk through it.
Step 1: Create Your Account
- Go to Harbor Scale Sign Up
- Fill in your details and create your account
- Check your inbox for a verification email
- Click the verification link to activate your account
- Log in to your Harbor Scale dashboard
Step 2: Create a Harbor
A "harbor" is essentially your data destination - where all your Meshtastic telemetry gets stored.
- In the top right corner, click "Create Harbor"
- Give your harbor a name (e.g., "Meshtastic Network")
- Choose the harbor type:
- Select "General" type (custom types like GPS or temperature will be added in future updates)
- Choose your Harbor Specifications: Free Tier: 3M data points/month, 7 days retention, 10 AI queries/day
- Click "Create Harbor"
After creation, your new harbor will appear in the harbor list.
Step 3: Connect Your Meshtastic Device
This is where Harbor Scale's new process shines - it's incredibly simple now!
- Click on your harbor to open the details
- Navigate to the "Connect" tab
- Select "Meshtastic Gateway" from the available options
You'll see a streamlined setup process with three steps:
Install Lighthouse (Harbor Scale's Agent)
Choose your operating system and run the installer:
Linux (requires sudo privileges):
curl -sL get.harborscale.com | sudo bash
Windows (run in PowerShell as Administrator):
iwr get.harborscale.com/ | iex
Install Mesh Engine (Meshtastic Driver)
This is the driver that lets Lighthouse communicate with LoRa devices:
Linux:
curl -sL get.harborscale.com/meshtastic | sudo bash
Windows:
iwr get.harborscale.com/meshtastic | iex
Run the Gateway Command
Now for the final step - connect your Meshtastic device!
- Plug your Meshtastic device into your computer via USB
- Copy the command shown in the Harbor Scale interface (it will have your Harbor ID and API Key pre-filled)
- Run it in your terminal
Linux:
sudo lighthouse --add \
  --name "mesh-gateway" \
  --harbor-id "YOUR_HARBOR_ID" \
  --key "YOUR_API_KEY" \
  --source exec \
  --param command="mesh_engine --ttl 3600"
Windows:
lighthouse --add \
  --name "mesh-gateway" \
  --harbor-id "YOUR_HARBOR_ID" \
  --key "YOUR_API_KEY" \
  --source exec \
  --param command="mesh_engine --ttl 3600"
What Just Happened?
The Lighthouse agent is now running in the background on your computer. It will:
- Listen to your USB-connected Meshtastic device
- Collect telemetry from any node it hears (your node + any nodes in range)
- Automatically ship metrics to Harbor Scale including:
- Battery voltage and percentage
- Signal strength (SNR and RSSI)
- Environmental sensors (if configured)
- GPS coordinates
- Channel utilization
- Air utilization time
That's it! Your Meshtastic telemetry is now flowing to the cloud. No configuration files, no complex setup - just three simple commands.
Viewing Your Data in Grafana
Now for the fun part - seeing your data in beautiful dashboards!
Access Your Grafana Instance
- Go back to your Harbor Details page
- Navigate to the "Visualize" tab
- You'll see:
- Grafana Endpoint: Your personal Grafana URL
- Grafana Username: (same as your Harbor Scale email)
- Grafana Password: Click to reveal
- Click the Grafana Endpoint to open your dashboard
- Log in with your username and password
Explore the Demo Dashboard
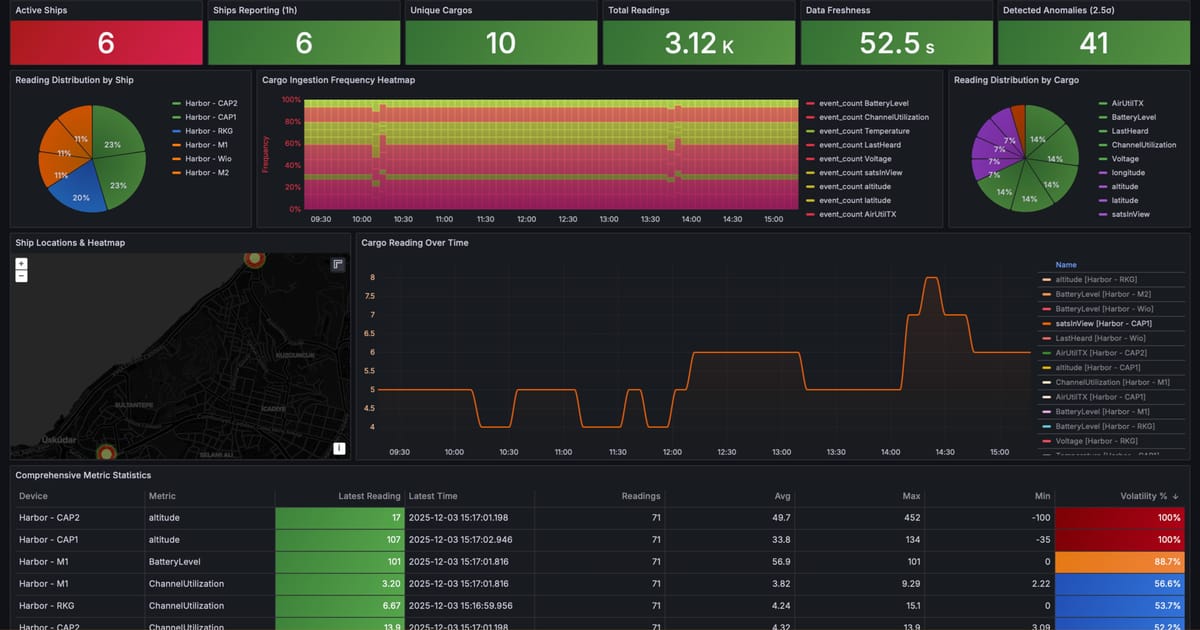
Harbor Scale provides a pre-built "Comprehensive Telemetry Dashboard" to get you started:
- Once logged in, go to Dashboards in the left sidebar
- Select "Comprehensive Telemetry Dashboard"
- Choose your data source (your harbor name)
- Use the filters to view data by:
- ship_id: The devies name (e.g., "mesh-01")
- cargo_id: Individual metrics identifiers
What You'll See
The demo dashboard includes multiple panels showing:
Battery Monitoring
- Current battery voltage
- Battery percentage over time
Signal Quality
- SNR (Signal-to-Noise Ratio) trends
- RSSI (Received Signal Strength Indicator)
- Signal quality by node
Environmental Data (if you have sensors configured)
- Temperature trends
- Humidity levels
- Barometric pressure
- UV index (if using LTR390 sensor)
Check out our sensor integration guides:
Network Performance
- Channel utilization
- Air utilization time
GPS Mapping (if GPS is enabled)
- Real-time node locations on an interactive map
- Movement tracking over time
- Distance calculations
Harbor AI: Talk to Your Data
One of Harbor Scale's coolest features is Harbor AI (currently in beta) - it lets you query your data using natural language instead of building complex dashboards.
How to Use Harbor AI
- In your Harbor Scale dashboard, navigate to "Harbor AI" in the left sidebar
- Simply type your question in plain English
Example Queries
Battery Monitoring:
- "What was the average battery level of my nodes last week?"
- "Show me nodes with battery below 20%"
- "Which node has the lowest battery right now?"
Signal Quality:
- "What's the average SNR for node ABC123?"
- "Show me signal strength trends for the past 24 hours"
- "Which nodes have poor signal quality?"
Environmental Data:
- "What was the temperature range yesterday?"
- "Show me humidity levels for all sensors"
- "Which location had the highest UV index this week?"
Why Use Harbor AI?
- No query language needed: Just ask in plain English
- Instant answers: Get results without building dashboards
- Quick troubleshooting: Rapidly diagnose network issues
- Exploratory analysis: Ask follow-up questions to dig deeper
Next Steps & Related Guides
Now that you have professional visualization for your Meshtastic network, here are some ways to expand:
Add More Sensors
Expand Your Network
Advanced Integrations
Conclusion
Visualizing your Meshtastic telemetry data has never been easier. With Harbor Scale's new streamlined onboarding, you can go from zero to professional Grafana dashboards in under 5 minutes - no server setup, no complex configuration, just three simple commands.
Whether you're monitoring a small personal network or managing a large community deployment, having real-time visibility into battery levels, signal quality, and environmental data makes network management significantly easier. Add in Harbor AI for natural language queries, and you have a complete monitoring solution that rivals enterprise-grade systems.
Got questions or want to share your dashboards? Drop a comment below or reach out through our contact page. Happy monitoring!