How to Visualize The Things Network Data in Grafana (Real-Time & Easy)
Turn your LoRaWAN data from TTN into live Grafana dashboards in under 10 minutes with Harbor Scale. One webhook, zero infrastructure, automatic decoding, network metrics, and optional self-hosted OSS version no Docker, databases, or cloud expertise required.
You've deployed LoRaWAN sensors. They're transmitting to The Things Network perfectly. But here's where most people get stuck: turning that raw sensor data into actual dashboards you can use. If you've searched for "The Things Network Grafana visualization" or "how to store TTN data," you've probably found tutorials that require setting up InfluxDB, configuring Telegraf with MQTT, wrestling with Docker containers, or paying for Azure IoT Hub. Hours of configuration, multiple moving parts that can break, and the constant burden of maintenance.
There's a simpler path. Harbor Scale TTN integration connects your LoRaWAN data to production-ready Grafana dashboards in under 10 minutes. One webhook, zero infrastructure, and your sensor data starts flowing immediately with RSSI, SNR, and network quality metrics automatically included.
The Storage Problem Nobody Talks About
The Things Network receives your data perfectly, but it only stores it for seven days. After that, it's gone. This puts you in an impossible position: either build custom storage infrastructure yourself, or lose all your historical sensor data. Most tutorials gloss over this critical gap, jumping straight to visualization while ignoring the fundamental question of where your data actually lives long-term.
Setting up your own database means installing InfluxDB or PostgreSQL, configuring retention policies, managing disk space, implementing backups, monitoring database health, and keeping everything secure and patched. Cloud alternatives like Azure IoT Hub or AWS IoT Core solve the storage problem but introduce new challenges: complex configuration interfaces, data ingestion fees, storage costs that scale with usage, and the expertise needed to manage cloud infrastructure properly.
What you actually need to get started:
- LoRaWAN device sending data to The Things Network
- The Things Network V3 account (free tier works perfectly)
- Harbor Scale account (free tier: 1 request/second, 3 million data points, plus 10 AI questions daily)
- 10 minutes of your time
No Docker installation. No database configuration. No cloud platform expertise required.
Why Harbor Scale is Different
Instead of making you become a DevOps engineer just to see your sensor data, Harbor Scale provides a dead-simple webhook integration:
- Zero Infrastructure: No servers to provision, no databases to configure, no Docker networks to debug
- Instant Grafana Access: Pre-configured Grafana instance included with every harbor
- Automatic Payload Decoding: Your TTN payload formatter runs in TTN; Harbor Scale automatically ingests the decoded result
- Network Metrics Included: RSSI, SNR, spreading factor, frequency, all captured automatically for every uplink
- Actually Free (for real): 1 request/second (86,400 requests per day), which means a 20-sensor fleet transmitting every 10 minutes uses only 2,880 of your daily quota.
Compare that to self-hosting: a basic DigitalOcean droplet starts at $6/month, plus your own setup and maintenance time. Azure or AWS? Their managed time-series databases start at $23/month, before data transfer and storage fees.
But wait, what if you want full control over your data?
Harbor Scale also comes with a free, fully open-source, self-hosted version. Run it on your own hardware, Raspberry Pi, mini-PC, NAS, home server, whatever you have. Get the OSS version here:
Step 1: Create Your TTN Harbor (2 minutes)
Log into Harbor Scale and create a new harbor:
- Click Create Harbor
- Name it something like "Field_Sensors" or "LoRaWAN_Fleet"
- Select The Things Network as the Harbor Type (not "General")
- Choose Free tier to start
- Click Create Harbor
From the harbor details page, copy these credentials (you'll need them in a minute):
From API Access tab:
- TTN Webhook Endpoint (e.g.,
https://telemetryharbor.com/api/v2/ingest/123/ttn) - API Key
From Visualization tab:
- Grafana URL
- Grafana Username
- Grafana Password
Step 2: Configure Your Payload Formatter (5 minutes)
Here's the one technical requirement: your TTN payload formatter must return flat, numerical data. This runs on TTN's servers (not yours), and Harbor Scale automatically ingests the decoded result.
Why This Matters
LoRaWAN devices send raw bytes to save battery and bandwidth. TTN needs to decode these bytes into meaningful numbers before sending to integrations. Without this step, Harbor Scale would receive 0x1850 instead of temperature: 24, humidity: 80.
Write Your Decoder
In your TTN Console:
- Go to Applications → Your Application → Payload Formatters → Uplink
- Select Javascript
- Paste your decoder function
Example for a basic environmental sensor:
function decodeUplink(input) {
    // TTN passes Base64 or HEX depending on input
    let bytes = input.bytes;

    if (!bytes) {
        // Convert HEX string to byte array
        bytes = [];
        for (let i = 0; i < input.frm_payload.length; i += 2) {
            bytes.push(parseInt(input.frm_payload.substr(i, 2), 16));
        }
    }

    let temperature = ((bytes[0] << 8) | bytes[1]) / 100;
    let humidity = bytes[2];
    let battery = bytes[3];
    let status = String.fromCharCode.apply(null, bytes.slice(4));

    return {
        data: {
            temperature,
            humidity,
            battery,
            status
        }
    };
}
Test it: Use the Test tab with sample hex payload to verify output, then click Save.
Step 3: Add the Webhook to TTN (3 minutes)
This is where the magic happens. No MQTT clients, no Telegraf configs, no debugging connection strings.
In your TTN Application:
- Go to Webhooks → + Add Webhook
- Select Custom Webhook
- Configure exactly as shown:
- Webhook ID:
telemetry-harbor - Webhook Format:
JSON - Base URL: Paste your TTN Webhook Endpoint from Step 1
- Additional Headers:
- Key:
X-API-Key - Value: Your Harbor Scale API Key
- Key:
- Enabled Messages:
- ✅ Uplink message (required)
- ❌ Uncheck everything else
- Click Add webhook
That's the entire setup. No Docker compose files, no environment variables, no service restarts. Your data is now flowing.
Step 4: Check Your Grafana Dashboard
Open your Grafana Endpoint URL, log in with your credentials, and navigate to Dashboards → Comprehensive Telemetry Dashboard.

Use the filter controls to focus on specific aspects of your deployment. Select your TTN harbor as the data source, filter by Ship ID to view specific devices, choose Cargo IDs to display particular metrics, and adjust time ranges to see historical patterns. The interface makes it simple to zoom into problem areas or zoom out for fleet-wide analysis.
For custom visualizations beyond the default dashboard, create panels tailored to your monitoring needs.
The Harbor Scale Advantage: Harbor AI
This is where Harbor Scale goes beyond "just another dashboard platform." Harbor AI lets you ask questions about your LoRaWAN fleet in plain English:
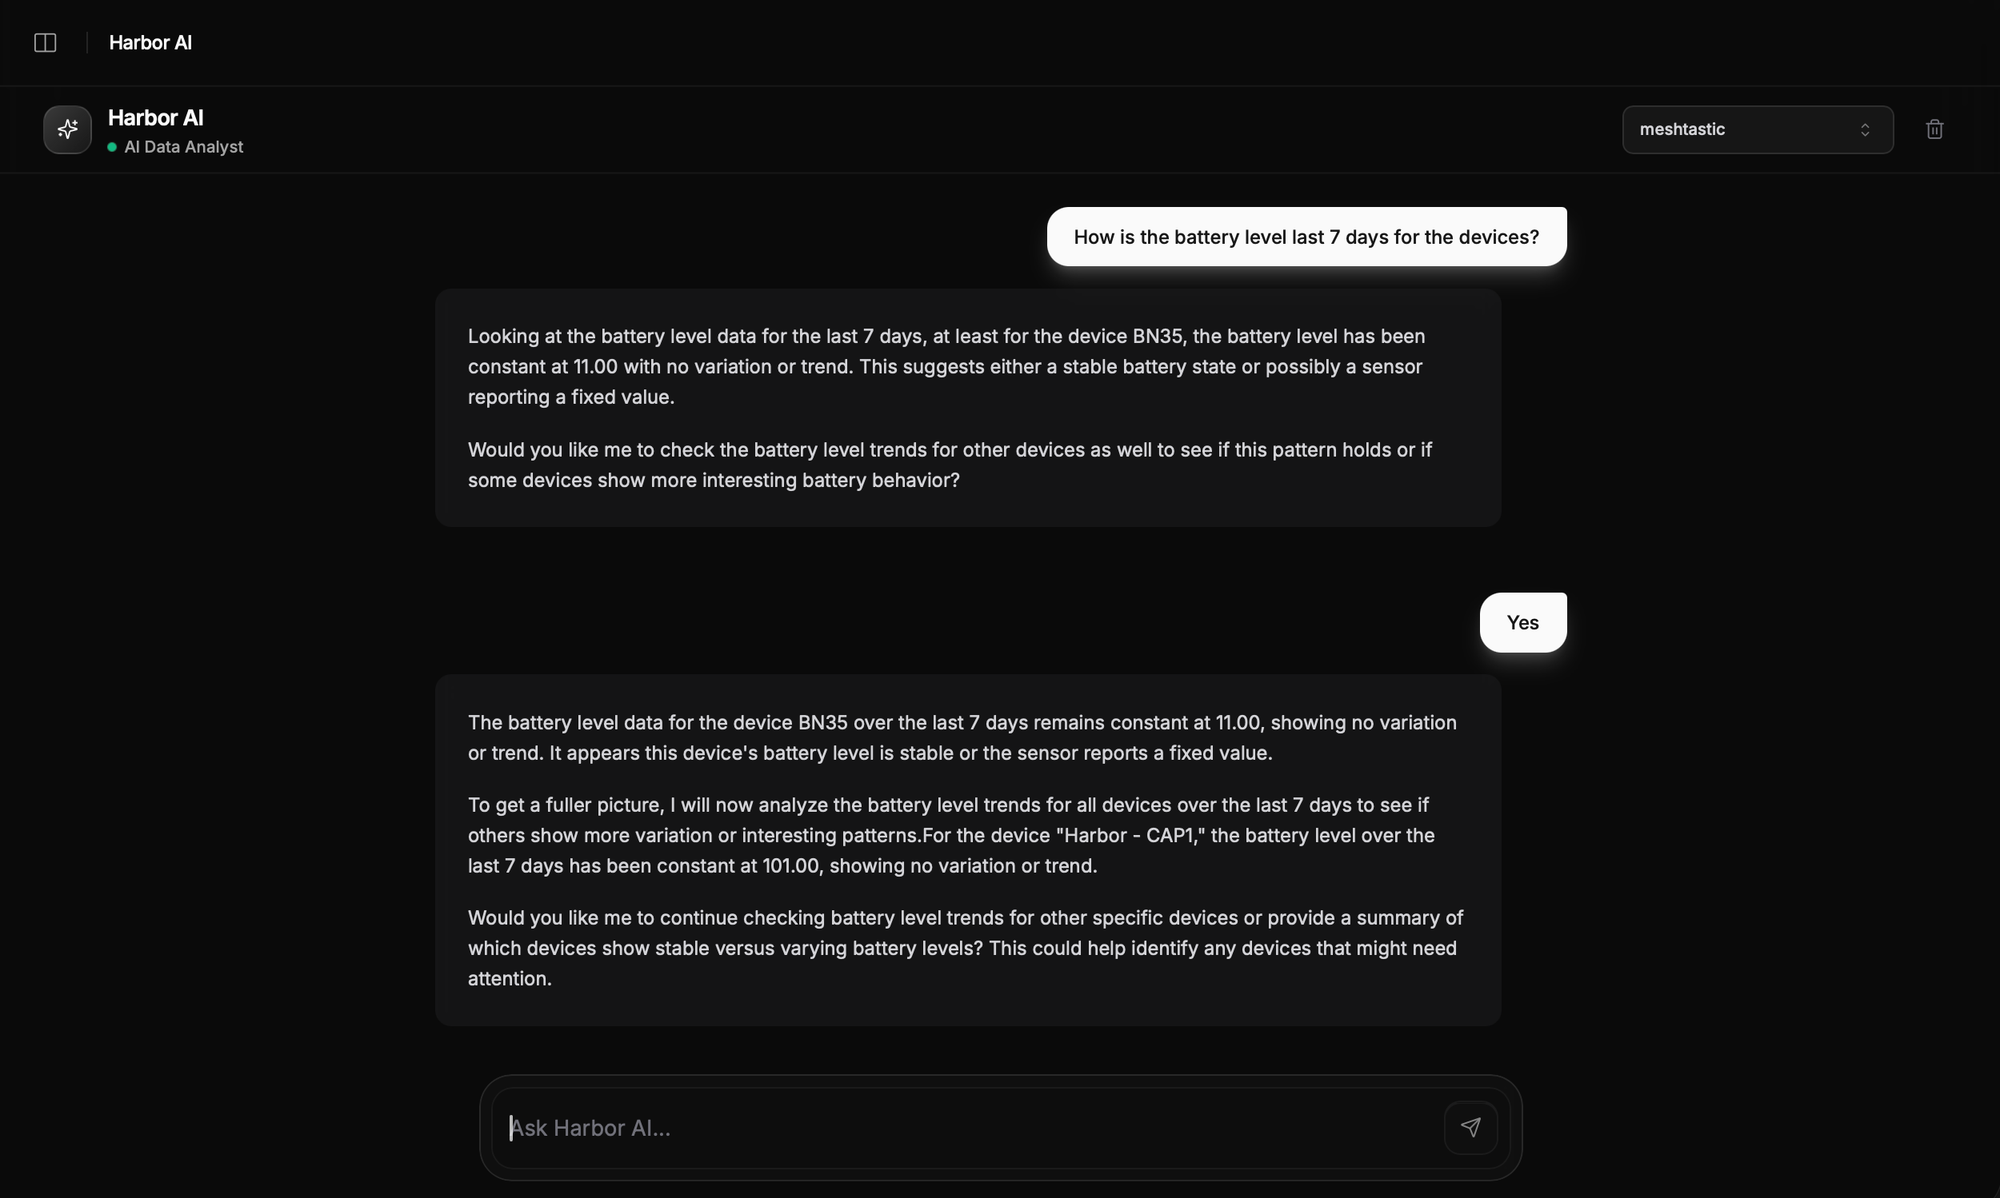
Example Conversations:
You: "Which sensors have the weakest signal right now?"
Harbor AI: "Based on the last hour of RSSI data:
soil-sensor-03: -118 dBm (critical, likely dropping packets)
field-monitor-07: -112 dBm (weak but stable)
All other devices: -95 dBm or better
Sensor-03's signal has degraded 15 dBm since Monday. Consider relocating the gateway or adding a repeater."
Harbor AI combines your specific sensor data with general LoRaWAN knowledge to provide insights you'd otherwise need to piece together manually from multiple Grafana panels.
Conclusion
LoRaWAN sensors should simplify monitoring, not create infrastructure problems. The path from TTN to actionable dashboards has traditionally required database expertise, DevOps skills, or cloud platform knowledge that most sensor deployments don't need and shouldn't require.
Harbor Scale changes this equation by treating TTN integration as a solved problem rather than a DIY project. One webhook connects your entire LoRaWAN fleet to production-grade storage and visualization. Your data flows continuously, dashboards update in real-time, and network quality metrics appear automatically alongside your sensor readings. No infrastructure to manage, no cloud bills to monitor, no maintenance windows to schedule.
The comprehensive Grafana dashboard displays your data immediately without requiring panel configuration or query building. Harbor AI answers questions about your fleet in plain language without requiring dashboard expertise. Network quality metrics help optimize gateway placement and diagnose connectivity issues without specialized LoRaWAN tools.
Ready to Get Started? Create a free Harbor Scale account, configure the TTN webhook, and see your first data in under 10 minutes. The free tier handles real deployments at zero cost, and paid plans remain dramatically cheaper than cloud alternatives if you need to scale. Your LoRaWAN data deserves better than DIY infrastructure projects or expensive cloud platforms. Choose the simple path.